偵錯網頁應用程式的效能
學習如何使用 Chrome DevTools 偵錯網頁效能問題。
Flutter 框架在建構畫面(frame)、繪製場景(scene)以及追蹤其他活動(如垃圾回收)時,會發出時間軸事件(timeline events)。 這些事件會在 Chrome DevTools 效能面板 中公開,供偵錯使用。
你也可以使用 dart:developer
Timeline
和 TimelineTask API 發出自訂的時間軸事件,以進行更深入的效能分析。
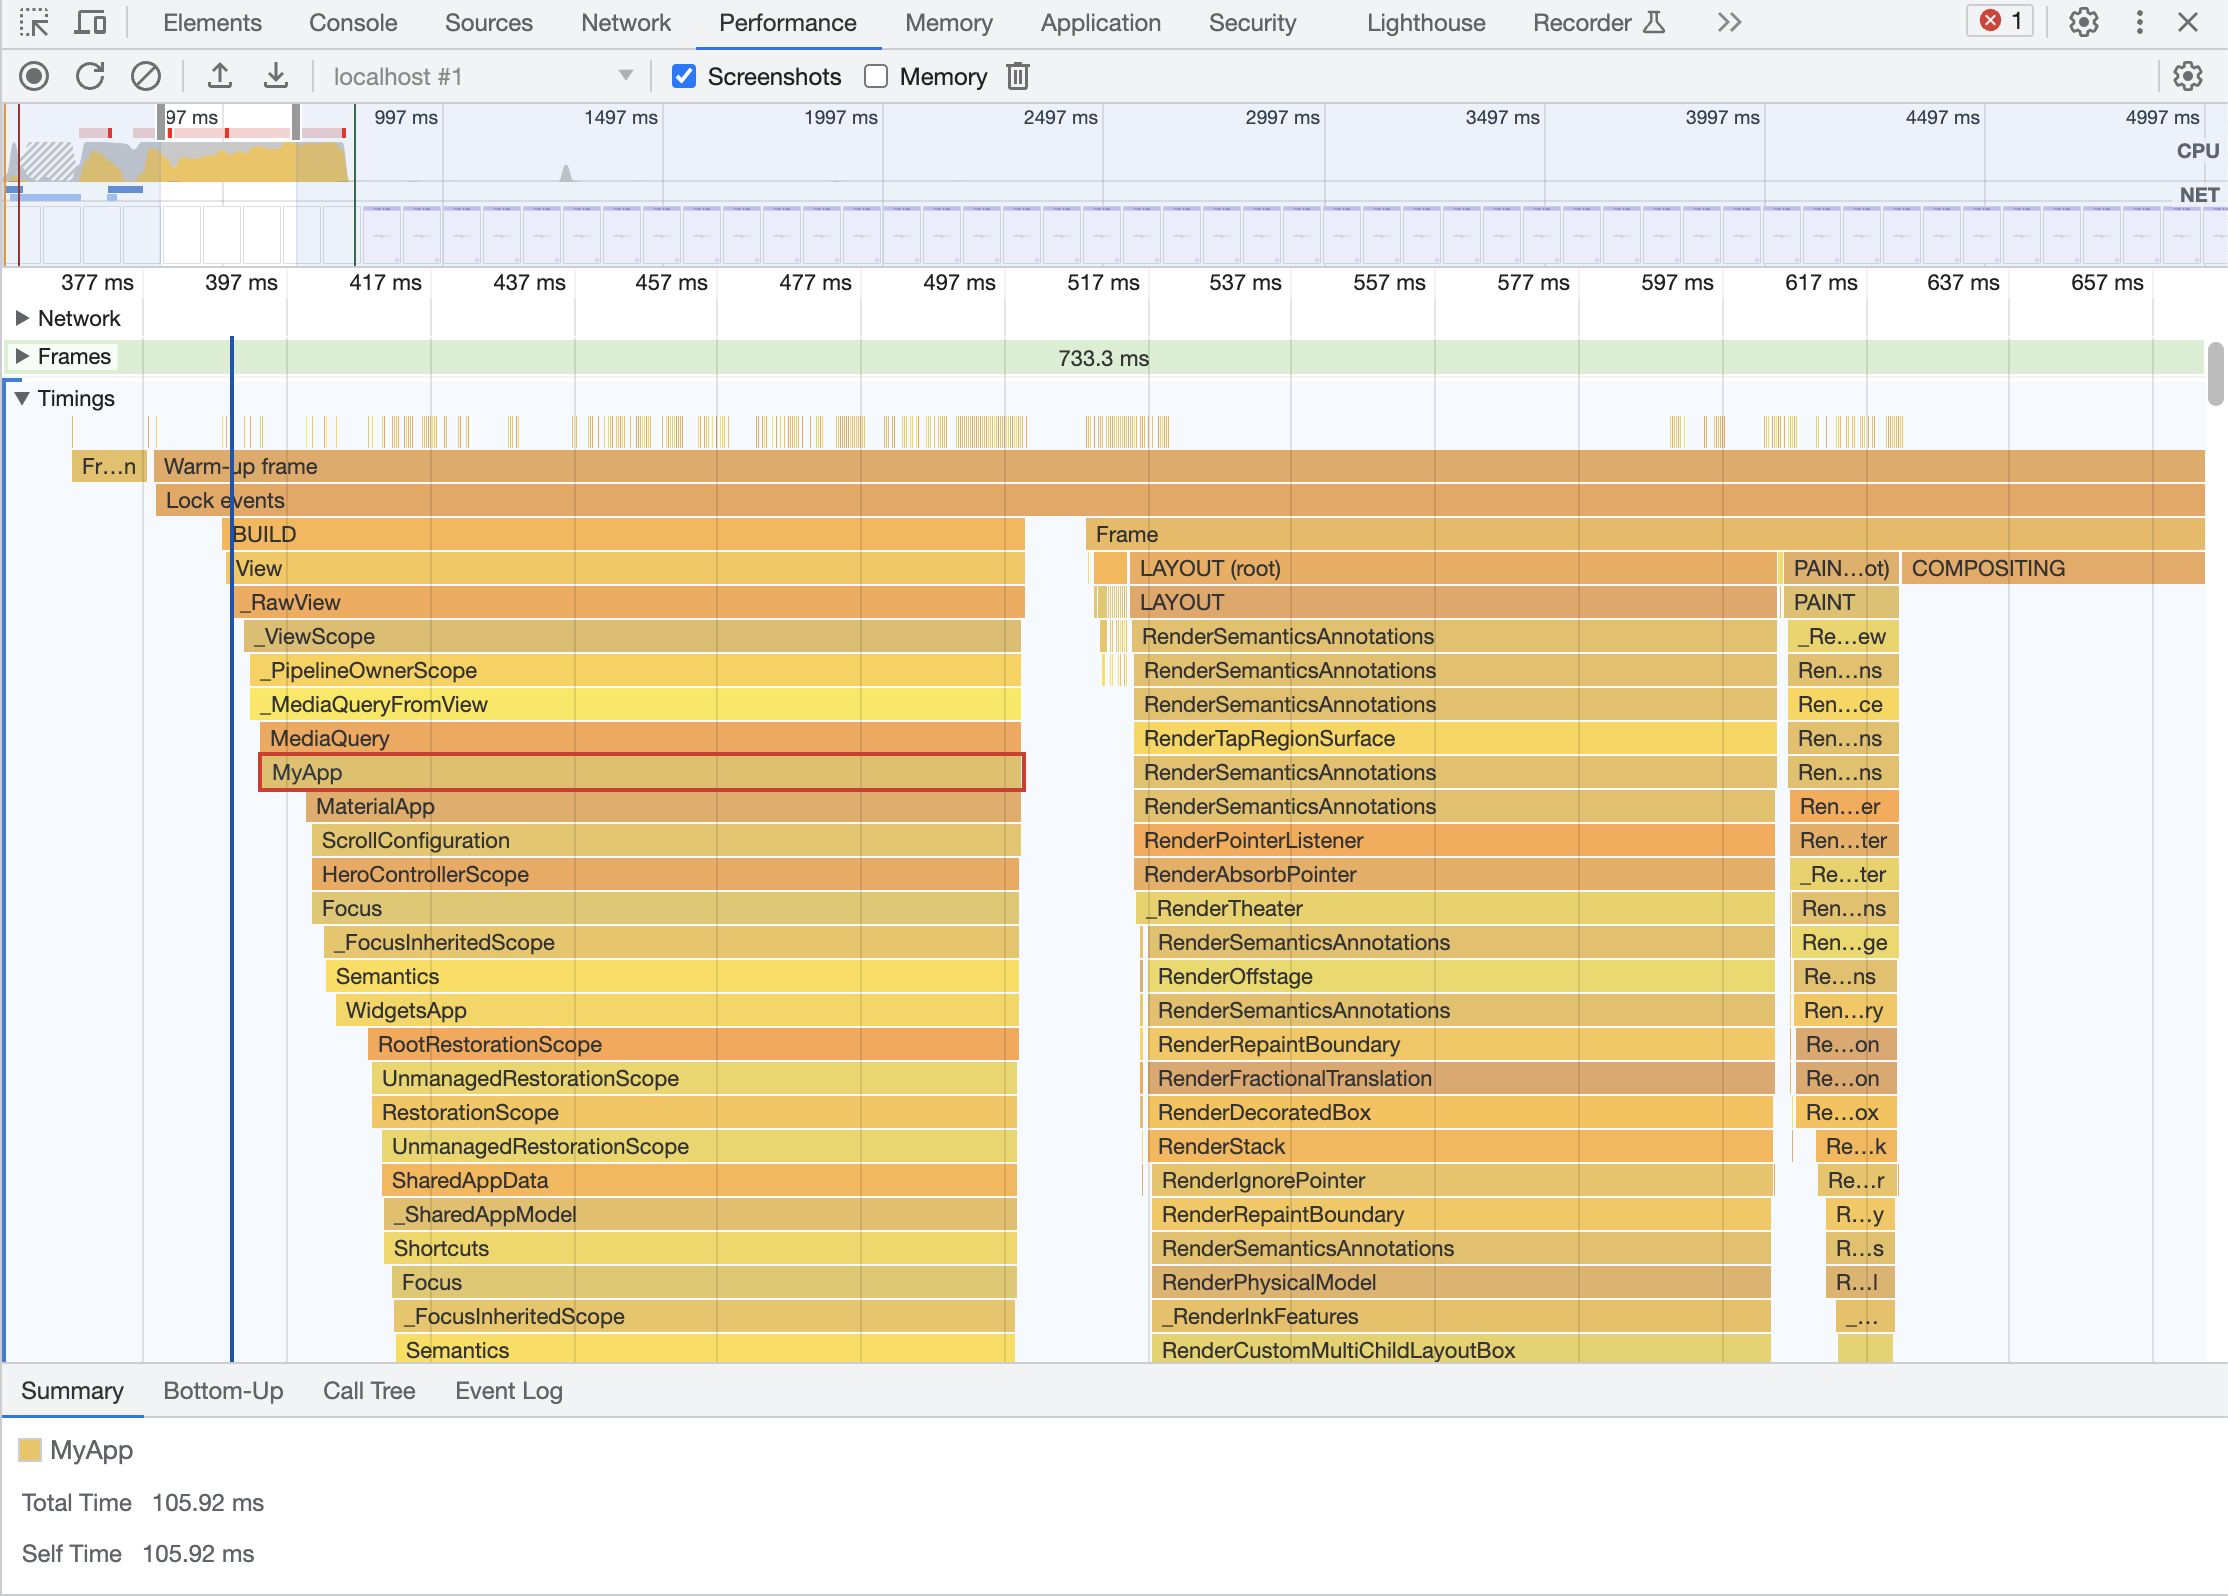
可選旗標以增強追蹤
#若要設定哪些時間軸事件會被追蹤,可以在應用程式的 main 方法中,將下列任一頂層屬性設為 true。
-
debugProfileBuildsEnabled:為每個建構的
Widget新增Timeline事件。 -
debugProfileBuildsEnabledUserWidgets:為每個使用者自訂的
Widget建構新增Timeline事件。 -
debugProfileLayoutsEnabled:為每個
RenderObject版面配置新增Timeline事件。 -
debugProfilePaintsEnabled:為每個繪製的
RenderObject新增Timeline事件。
操作說明
#- [可選] 從應用程式的 main 方法中,將需要的追蹤旗標設為 true。
- 以 profile mode 執行你的 Flutter 網頁應用程式。
- 開啟應用程式的 Chrome DevTools 效能面板, 並開始錄製以擷取時間軸事件。
Was this page's content helpful?
Unless stated otherwise, the documentation on this site reflects Flutter 3.44.0. Page last updated on 2026-06-14. View source or report an issue.