使用原生語言除錯器
如何將原生除錯器連接到正在執行的 Flutter 應用程式。
如果你只用 Dart 程式碼撰寫 Flutter 應用程式,可以直接使用你的 IDE 除錯器來除錯程式碼。Flutter 團隊推薦使用 VS Code。
如果你撰寫平台專屬的插件 (plugin) 或使用平台專屬的函式庫,你可以使用原生除錯器來除錯這部分的程式碼。
- 若要除錯以 Swift 或 Objective-C 撰寫的 iOS 或 macOS 程式碼,可以使用 Xcode。
- 若要除錯以 Java 或 Kotlin 撰寫的 Android 程式碼,可以使用 Android Studio。
- 若要除錯以 C++ 撰寫的 Windows 程式碼,可以使用 Visual Studio。
本指南將說明如何為你的 Dart 應用程式同時連接「兩個」除錯器,一個用於 Dart,另一個用於原生程式碼。
除錯 Dart 程式碼
#本指南將說明如何使用 VS Code 來除錯你的 Flutter 應用程式。你也可以使用你偏好的 IDE,只要安裝並設定好 Flutter 與 Dart 外掛即可。
使用 VS Code 除錯 Dart 程式碼
#以下步驟說明如何使用 Dart 除錯器來除錯預設的 Flutter 範例應用程式。這些在 VS Code 中提供的功能元件,在你除錯自己的 Flutter 專案時同樣適用且會顯示。
-
建立一個基本的 Flutter 應用程式。
flutter create my_appCreating project my_app... Resolving dependencies in my_app... Got dependencies in my_app. Wrote 129 files. All done! You can find general documentation for Flutter at: https://docs.flutter.dev/ Detailed API documentation is available at: https://api.flutter.dev/ If you prefer video documentation, consider: https://www.youtube.com/c/flutterdev In order to run your application, type: $ cd my_app $ flutter run Your application code is in my_app/lib/main.dart.cd my_app 在 Flutter 應用程式中,使用 VS Code 開啟
lib\main.dart檔案。-
點擊錯誤偵錯圖示(bug icon) (
 )。
這會在 VS Code 中開啟以下面板:
)。
這會在 VS Code 中開啟以下面板:- Debug
- Debug Console
- Widget Inspector(元件 (Widget) 檢查器)
第一次執行偵錯工具時,所需時間會比較長。
-
測試偵錯工具。
a. 在
main.dart中,點擊這一行:dart_counter++;b. 按下 Shift + F9。 這會在
_counter變數遞增的地方新增一個中斷點。c. 在應用程式中,點擊 + 按鈕 來遞增計數器。應用程式會暫停。
d. 此時,VS Code 會顯示:
- 在 編輯器群組(Editor Groups) 中:
main.dart中被標記的中斷點- Flutter 應用程式的元件階層(widget hierarchy), 顯示於 Widget Inspector 的 Widget Tree
- 在 側邊欄(side bar) 中:
- Call Stack 區段中的應用程式狀態
- Variables 區段中
this區域變數的值
- 在 面板(panel) 中:
- Debug console 中 Flutter 應用程式的日誌
- 在 編輯器群組(Editor Groups) 中:
VS Code Flutter 除錯器
#Flutter 外掛程式會為 VS Code 增加多項使用者介面元件。
VS Code 介面變更
#啟動後,Flutter 除錯器會在 VS Code 介面中加入除錯工具。
下方的螢幕截圖與表格說明了各個工具的用途。
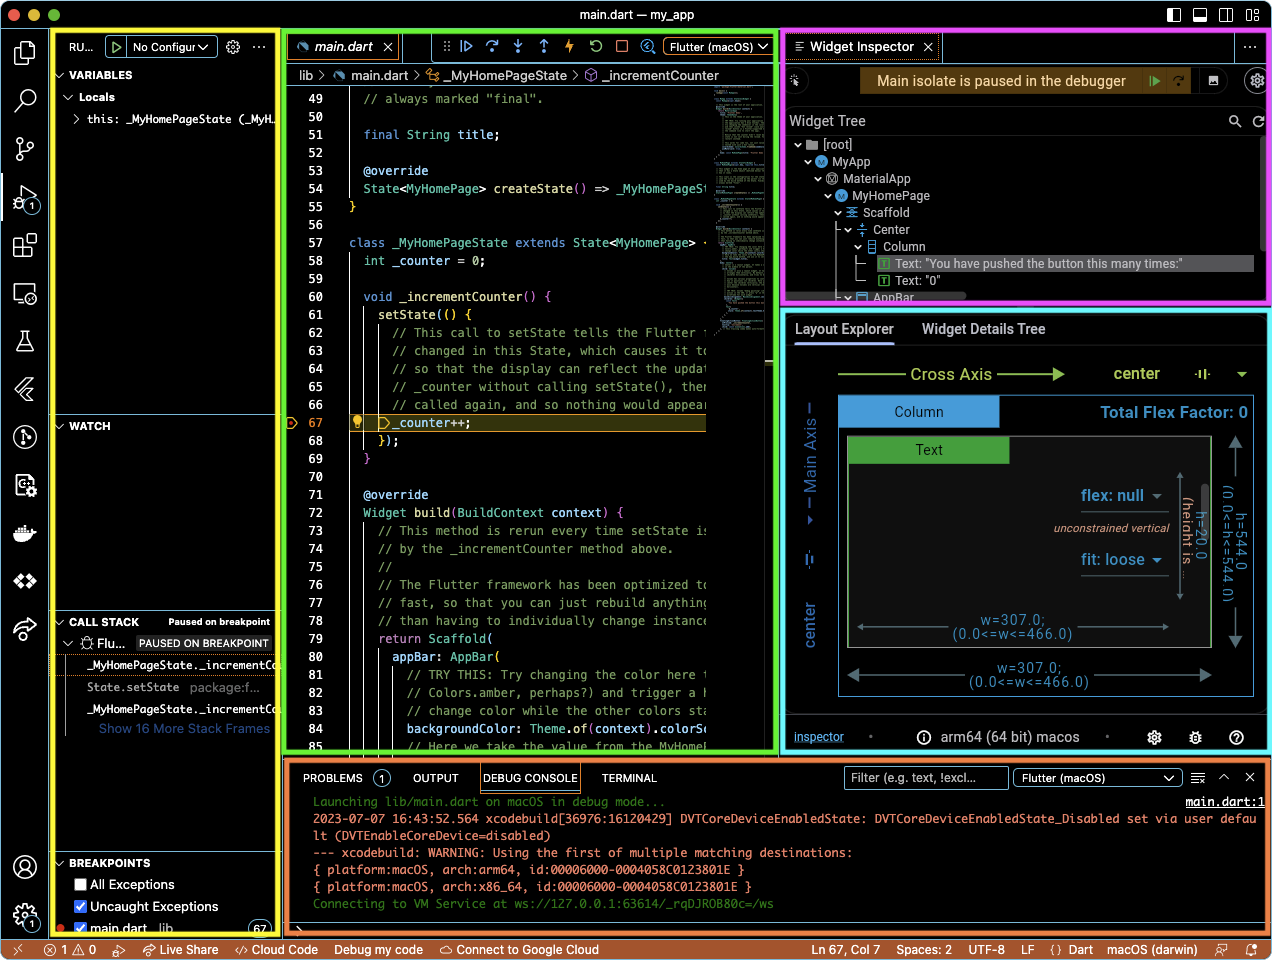
| 螢幕截圖標示顏色 | 列、面板或分頁 | 內容說明 |
|---|---|---|
| 黃色 | Variables | Flutter 應用程式中變數的目前值列表 |
| Watch | 你選擇追蹤的 Flutter 應用程式項目列表 | |
| Call Stack | Flutter 應用程式中作用中的子程序堆疊 | |
| Breakpoints | 你所設定的例外與中斷點列表 | |
| 綠色 | <Flutter files> | 你正在編輯的檔案 |
| 粉紅色 | Widget Inspector | 執行中的 Flutter 應用程式元件階層 |
| 藍色 | Layout Explorer | Flutter 如何在 Widget Inspector 中放置你所選元件的視覺化呈現 |
| Widget Details Tree | Widget Inspector 中所選元件的屬性列表 | |
| 橘色 | Problems | Dart 分析器在目前 Dart 檔案中發現的問題列表 |
| Output | 建置應用程式時 Flutter 應用程式回傳的回應 | |
| Debug Console | 除錯時 Flutter 應用程式產生的日誌或錯誤訊息 | |
| Terminal | VS Code 內建的系統命令列提示字元 |
若要變更 VS Code 中面板(橘色)的位置, 請前往 檢視(View) > 外觀(Appearance) > 面板位置(Panel Position)。
VS Code Flutter 除錯工具列
#此工具列可讓你使用任何除錯器進行除錯。 你可以逐步執行 Dart 陳述式、熱重載(hot reload)、或繼續執行應用程式。

| 圖示 | 動作 | 預設鍵盤快捷鍵 |
|---|---|---|
|
|
||
| 啟動或繼續執行 | F5 | |
|
|
||
| 暫停 | F6 | |
|
|
||
| 單步跳過(Step Over) | F10 | |
|
|
||
| 單步執行(Step Into) | F11 | |
|
|
||
| 單步跳出(Step Out) | Shift + F11 | |
|
|
||
| 熱重載(Hot Reload) | Ctrl + F5 | |
|
|
||
| 熱重啟(Hot Restart) | Shift + Special + F5 | |
|
|
||
| 停止 | Shift + F5 | |
|
|
||
| 開啟 Widget Inspector |
更新測試用 Flutter 應用程式
#在本指南的接下來部分,你需要更新測試用 Flutter 應用程式。這次更新會加入可進行原生除錯的程式碼。
使用你偏好的 IDE 開啟
lib/main.dart檔案。-
用下列程式碼取代
main.dart的內容。展開以檢視本範例的 Flutter 程式碼
lib/main.dartdart// Copyright 2023 The Flutter Authors. All rights reserved. // Use of this source code is governed by a BSD-style license that can be // found in the LICENSE file. import 'package:flutter/material.dart'; import 'package:url_launcher/url_launcher.dart'; void main() { runApp(const MyApp()); } class MyApp extends StatelessWidget { const MyApp({super.key}); @override Widget build(BuildContext context) { return MaterialApp( title: 'URL Launcher', theme: ThemeData( colorSchemeSeed: Colors.purple, brightness: Brightness.light, ), home: const MyHomePage(title: 'URL Launcher'), ); } } class MyHomePage extends StatefulWidget { const MyHomePage({super.key, required this.title}); final String title; @override State<MyHomePage> createState() => _MyHomePageState(); } class _MyHomePageState extends State<MyHomePage> { Future<void>? _launched; Future<void> _launchInBrowser(Uri url) async { if (!await launchUrl( url, mode: LaunchMode.externalApplication, )) { throw Exception('Could not launch $url'); } } Future<void> _launchInWebView(Uri url) async { if (!await launchUrl( url, mode: LaunchMode.inAppWebView, )) { throw Exception('Could not launch $url'); } } Widget _launchStatus(BuildContext context, AsyncSnapshot<void> snapshot) { if (snapshot.hasError) { return Text('Error: ${snapshot.error}'); } else { return const Text(''); } } @override Widget build(BuildContext context) { final Uri toLaunch = Uri( scheme: 'https', host: 'docs.flutter.dev', path: 'testing/native-debugging'); return Scaffold( appBar: AppBar( title: Text(widget.title), ), body: Center( child: Column( mainAxisAlignment: MainAxisAlignment.center, children: <Widget>[ Padding( padding: const EdgeInsets.all(16), child: Text(toLaunch.toString()), ), FilledButton( onPressed: () => setState(() { _launched = _launchInBrowser(toLaunch); }), child: const Text('Launch in browser'), ), const Padding(padding: EdgeInsets.all(16)), FilledButton( onPressed: () => setState(() { _launched = _launchInWebView(toLaunch); }), child: const Text('Launch in app'), ), const Padding(padding: EdgeInsets.all(16.0)), FutureBuilder<void>(future: _launched, builder: _launchStatus), ], ), ), ); } } -
若要將
url_launcher套件新增為相依套件,請執行flutter pub add:flutter pub add url_launcherResolving dependencies... collection 1.17.1 (1.17.2 available) + flutter_web_plugins 0.0.0 from sdk flutter matcher 0.12.15 (0.12.16 available) material_color_utilities 0.2.0 (0.8.0 available) + plugin_platform_interface 2.1.4 source_span 1.9.1 (1.10.0 available) stream_channel 2.1.1 (2.1.2 available) test_api 0.5.1 (0.6.1 available) + url_launcher 6.1.11 + url_launcher_android 6.0.36 + url_launcher_ios 6.1.4 + url_launcher_linux 3.0.5 + url_launcher_macos 3.0.5 + url_launcher_platform_interface 2.1.3 + url_launcher_web 2.0.17 + url_launcher_windows 3.0.6 Changed 10 dependencies! -
檢查程式碼庫有何變更:
在 Linux 或 macOS 上,執行此
find指令。find ./ -mmin -120./ios/Flutter/Debug.xcconfig ./ios/Flutter/Release.xcconfig ./linux/flutter/generated_plugin_registrant.cc ./linux/flutter/generated_plugins.cmake ./macos/Flutter/Flutter-Debug.xcconfig ./macos/Flutter/Flutter-Release.xcconfig ./macos/Flutter/GeneratedPluginRegistrant.swift ./pubspec.lock ./pubspec.yaml ./windows/flutter/generated_plugin_registrant.cc ./windows/flutter/generated_plugins.cmake在 Windows 中,請在命令提示字元(Command Prompt)執行以下指令。
Get-ChildItem C:\dev\example\ -Rescurse | Where-Object {$_.LastWriteTime -gt (Get-Date).AddDays(-1)}C:\dev\example\ios\Flutter\ Mode LastWriteTime Length Name ---- ------------- ------ ---- 8/1/2025 9:15 AM Debug.xcconfig 8/1/2025 9:15 AM Release.xcconfig C:\dev\example\linux\flutter\ Mode LastWriteTime Length Name ---- ------------- ------ ---- 8/1/2025 9:15 AM generated_plugin_registrant.cc 8/1/2025 9:15 AM generated_plugins.cmake C:\dev\example\macos\Flutter\ Mode LastWriteTime Length Name ---- ------------- ------ ---- 8/1/2025 9:15 AM Flutter-Debug.xcconfig 8/1/2025 9:15 AM Flutter-Release.xcconfig 8/1/2025 9:15 AM GeneratedPluginRegistrant.swift C:\dev\example\ Mode LastWriteTime Length Name ---- ------------- ------ ---- 8/1/2025 9:15 AM pubspec.lock 8/1/2025 9:15 AM pubspec.yaml C:\dev\example\windows\flutter\ Mode LastWriteTime Length Name ---- ------------- ------ ---- 8/1/2025 9:15 AM generated_plugin_registrant.cc 8/1/2025 9:15 AM generated_plugins.cmake
安裝 url_launcher 會在 Flutter 應用程式目錄中為所有目標平台新增設定檔與程式碼檔案。
同時偵錯 Dart 與原生語言程式碼
#本節說明如何同時使用 Flutter 的熱重載(hot reload)功能,來偵錯 Flutter 應用程式中的 Dart 程式碼,以及使用各自原生除錯器偵錯原生程式碼。此功能可讓你在編輯原生程式碼時,充分利用 Flutter 的熱重載。
使用 Android Studio 偵錯 Dart 與 Android 程式碼
#若要偵錯原生 Android 程式碼,你需要一個包含 Android 程式碼的 Flutter 應用程式。在本節中,你將學習如何將 Dart、Java 與 Kotlin 除錯器連接到你的應用程式。你不需要 VS Code 來同時偵錯 Dart 與 Android 程式碼。本指南包含 VS Code 的操作說明,是為了與 Xcode 及 Visual Studio 指南保持一致。
本節使用在更新測試用 Flutter 應用程式中建立的相同範例 Flutter url_launcher
應用程式。
在終端機中建置 Flutter 應用程式的 Android 版本
#
若要產生所需的 Android 平台相依套件,
請執行 flutter build 指令。
flutter build appbundle --debug
Running Gradle task 'bundleDebug'...                               27.1s
✓ Built build/app/outputs/bundle/debug/app-debug.aab.
先從 VS Code 開始除錯
#如果你大多使用 VS Code 來除錯程式碼,請從本節開始。
-
若要開啟 Flutter 應用程式目錄,請前往 File > Open Folder... 並選擇
my_app目錄。 開啟
lib/main.dart檔案。-
如果你可以為多部裝置建置應用程式, 則必須先選擇裝置。
前往 View > Command Palette...
你也可以按下 Ctrl / Cmd + Shift + P。
輸入
flutter select。點擊 Flutter: Select Device 指令。
選擇你的目標裝置。
-
點擊除錯圖示 (
)。
這會開啟 Debug 面板並啟動應用程式。
請等待應用程式在裝置上啟動,並等待除錯面板顯示 Connected。
除錯器第一次啟動需要較長時間,
後續啟動速度會加快。這個 Flutter 應用程式包含兩個按鈕:
- Launch in browser:此按鈕會在你裝置的預設瀏覽器中開啟此頁面。
- Launch in app:此按鈕會在你的應用程式中開啟此頁面。 此按鈕僅適用於 iOS 或 Android,桌面應用程式會啟動瀏覽器。
在 Android Studio 中附加至 Flutter 程序
#-
點擊 Attach debugger to Android process 按鈕。 (
 )
):::tip 若此按鈕未出現在 Projects 選單列中,請確認你開啟的是 Flutter 應用程式_專案,而_非 Flutter 插件。 :::
-
process 對話框會為每個已連接的裝置各顯示一個項目。 選取 show all processes 可顯示每個裝置的所有可用處理程序。
-
選擇你要附加的處理程序。 在本指南中,請使用 Emulator Pixel_5_API_33 選取
com.example.my_app處理程序。 在 Debug 面板中找到 Android Debugger 分頁。
-
在 Project 面板中,展開 my_app_android > android > app > src > main > java > io.flutter plugins。
-
雙擊 GeneratedProjectRegistrant 以在 Edit 面板中開啟 Java 程式碼。
完成此程序後,Dart 與 Android 除錯器會同時與同一個處理程序互動。 你可以使用其中一個或兩者同時使用,以設定中斷點、檢查堆疊、繼續執行 等各項操作,也就是進行除錯!
先從 Android Studio 開始除錯
#如果你大多使用 Android Studio 來除錯程式碼,請從本節開始。
-
若要開啟 Flutter 應用程式目錄,請前往 File > Open...,並選擇
my_app目錄。 開啟
lib/main.dart檔案。-
選擇一個 Android 虛擬裝置。 前往工具列,開啟最左側的下拉選單,然後點擊 Open Android Emulator: <device>。
你可以選擇任何已安裝且名稱不含
arm64的模擬器。 在同一選單中,選取該 Android 虛擬裝置。
-
在工具列中,點擊 Run 'main.dart'。
你也可以按下 Ctrl + Shift + R。
應用程式在模擬器中顯示後,繼續進行下一步。
-
點擊 Attach debugger to Android process 按鈕。 (
):::tip 若此按鈕未出現在 Projects 選單列中,請確認你開啟的是 Flutter 應用程式_專案,而_非 Flutter 插件。 :::
-
process 對話框會為每個已連接的裝置各顯示一個項目。 選取 show all processes 可顯示每個裝置的所有可用處理程序。
-
選擇你要附加的處理程序。 在本指南中,請使用 Emulator Pixel_5_API_33 選取
com.example.my_app處理程序。 在 Debug 面板中找到 Android Debugger 分頁。
-
在 Project 面板中,展開 my_app_android > android > app > src > main > java > io.flutter plugins。
-
雙擊 GeneratedProjectRegistrant 以在 Edit 面板中開啟 Java 程式碼。
完成此程序後,Dart 與 Android 除錯器會同時與同一個處理程序互動。 你可以使用其中一個或兩者同時使用,以設定中斷點、檢查堆疊、繼續執行 等各項操作,也就是進行除錯!
使用 Xcode 偵錯 Dart 與 iOS 程式碼
#若要偵錯 iOS 程式碼,你需要一個包含 iOS 程式碼的 Flutter 應用程式。在本節中,你將學習如何將兩個除錯器連接到你的應用程式:透過 VS Code 的 Flutter 除錯器,以及 Xcode。你需要同時執行 VS Code 與 Xcode。
本節使用在更新測試用 Flutter 應用程式中建立的相同範例 Flutter url_launcher
應用程式。
在終端機中建置 Flutter 應用程式的 iOS 版本
#
若要產生所需的 iOS 平台相依套件,
請執行 flutter build 指令。
flutter build ios --config-only --no-codesign --debug
Warning: Building for device with codesigning disabled. You will have to manually codesign before deploying to device.
Building com.example.myApp for device (ios)...
從 VS Code 開始除錯
#如果你主要使用 VS Code 來除錯程式碼,請從本節開始。
在 VS Code 中啟動 Dart 除錯工具
#-
若要開啟 Flutter 應用程式目錄,請前往 File > Open Folder... 並選擇
my_app目錄。 開啟
lib/main.dart檔案。-
如果你可以為多部裝置建置應用程式, 則必須先選擇裝置。
前往 View > Command Palette...
你也可以按下 Ctrl / Cmd + Shift + P。
輸入
flutter select。點擊 Flutter: Select Device 指令。
選擇你的目標裝置。
-
點擊除錯圖示 (
)。
這會開啟 Debug 面板並啟動應用程式。
請等待應用程式在裝置上啟動,並等待除錯面板顯示 Connected。
除錯器第一次啟動需要較長時間,
後續啟動速度會加快。這個 Flutter 應用程式包含兩個按鈕:
- Launch in browser:此按鈕會在你裝置的預設瀏覽器中開啟此頁面。
- Launch in app:此按鈕會在你的應用程式中開啟此頁面。 此按鈕僅適用於 iOS 或 Android,桌面應用程式會啟動瀏覽器。
在 Xcode 中附加至 Flutter 程序
#若要在 Xcode 中附加至 Flutter 應用程式:
-
前往 Debug > Attach to Process。
-
選擇 Runner。它應該位於 Attach to Process 選單頂端的 Likely Targets 標題下方。
從 Xcode 開始除錯
#如果你主要使用 Xcode 來除錯程式碼,請從本節開始。
啟動 Xcode 除錯工具
#從你的 Flutter 應用程式目錄開啟
ios/Runner.xcworkspace。-
使用工具列中的 Scheme 選單選擇正確的裝置。
如果你沒有特別偏好,請選擇 iPhone Pro 14。
-
以一般應用程式的方式在 Xcode 中執行此 Runner。
執行完成後,Xcode 底部的 Debug 區域會顯示 一則包含 Dart VM 服務 URI 的訊息,格式類似如下:
2023-07-12 14:55:39.966191-0500 Runner[58361:53017145] flutter: The Dart VM service is listening on http://127.0.0.1:50642/00wEOvfyff8=/ 複製 Dart VM 服務 URI。
在 VS Code 中附加至 Dart VM
#-
若要開啟指令面板,前往 View > Command Palette...
你也可以按下 Cmd + Shift + P。
輸入
debug。點擊 Debug: Attach to Flutter on Device 指令。
-
在 Paste an VM Service URI 欄位中,貼上你從 Xcode 複製的 URI,然後按下 Enter。
使用 Xcode 偵錯 Dart 與 macOS 程式碼
#若要偵錯 macOS 程式碼,你需要一個包含 macOS 程式碼的 Flutter 應用程式。在本節中,你將學習如何將兩個除錯器連接到你的應用程式:透過 VS Code 的 Flutter 除錯器,以及 Xcode。你需要同時執行 VS Code 與 Xcode。
本節使用在更新測試用 Flutter 應用程式中建立的相同範例 Flutter url_launcher
應用程式。
在終端機中建置 Flutter 應用程式的 macOS 版本
#
若要產生所需的 macOS 平台相依套件,
請執行 flutter build 指令。
flutter build macos --debug
Building macOS application...
先從 VS Code 開始除錯
#在 VS Code 中啟動除錯工具
#-
若要開啟 Flutter 應用程式目錄,請前往 File > Open Folder... 並選擇
my_app目錄。 開啟
lib/main.dart檔案。-
如果你可以為多部裝置建置應用程式, 則必須先選擇裝置。
前往 View > Command Palette...
你也可以按下 Ctrl / Cmd + Shift + P。
輸入
flutter select。點擊 Flutter: Select Device 指令。
選擇你的目標裝置。
-
點擊除錯圖示 (
)。
這會開啟 Debug 面板並啟動應用程式。
請等待應用程式在裝置上啟動,並等待除錯面板顯示 Connected。
除錯器第一次啟動需要較長時間,
後續啟動速度會加快。這個 Flutter 應用程式包含兩個按鈕:
- Launch in browser:此按鈕會在你裝置的預設瀏覽器中開啟此頁面。
- Launch in app:此按鈕會在你的應用程式中開啟此頁面。 此按鈕僅適用於 iOS 或 Android,桌面應用程式會啟動瀏覽器。
在 Xcode 中附加到 Flutter 程序
#-
若要附加到 Flutter 應用程式,請前往 Debug > Attach to Process > Runner。
Runner 應該會出現在 Attach to Process 選單頂端 Likely Targets 標題下方。
先從 Xcode 開始除錯
#在 Xcode 中啟動除錯工具
#從你的 Flutter 應用程式目錄開啟
macos/Runner.xcworkspace。-
在 Xcode 中以一般應用程式的方式執行此 Runner。
執行完成後,Xcode 底部的 Debug 區域會顯示 一則包含 Dart VM service URI 的訊息,格式類似如下:
2023-07-12 14:55:39.966191-0500 Runner[58361:53017145] flutter: The Dart VM service is listening on http://127.0.0.1:50642/00wEOvfyff8=/ 複製 Dart VM service URI。
在 VS Code 中附加到 Dart VM
#-
若要開啟指令面板,請前往 View > Command Palette...
你也可以按下 Cmd + Shift + P。
輸入
debug。點擊 Debug: Attach to Flutter on Device 指令。
-
在 Paste an VM Service URI 欄位中,貼上你從 Xcode 複製的 URI, 然後按下 Enter。
使用 Visual Studio 偵錯 Dart 與 C++ 程式碼
#若要偵錯 C++ 程式碼,你需要一個包含 C++ 程式碼的 Flutter 應用程式。在本節中,你將學習如何將兩個除錯器連接到你的應用程式:透過 VS Code 的 Flutter 除錯器,以及 Visual Studio。你需要同時執行 VS Code 與 Visual Studio。
本節使用在更新測試用 Flutter 應用程式中建立的相同範例 Flutter url_launcher
應用程式。
在 PowerShell 或命令提示字元中建置 Windows 版本的 Flutter 應用程式
#
要產生所需的 Windows 平台相依套件,
請執行 flutter build 指令。
C:\> flutter build windows --debug
Building Windows application...                                    31.4s
√  Built build\windows\runner\Debug\my_app.exe.
從 VS Code 開始除錯
#如果你大多使用 VS Code 進行除錯,請從本節開始。
在 VS Code 中啟動除錯工具
#-
若要開啟 Flutter 應用程式目錄,請前往 File > Open Folder... 並選擇
my_app目錄。 開啟
lib/main.dart檔案。-
如果你可以為多部裝置建置應用程式, 則必須先選擇裝置。
前往 View > Command Palette...
你也可以按下 Ctrl / Cmd + Shift + P。
輸入
flutter select。點擊 Flutter: Select Device 指令。
選擇你的目標裝置。
-
點擊除錯圖示 (
)。
這會開啟 Debug 面板並啟動應用程式。
請等待應用程式在裝置上啟動,並等待除錯面板顯示 Connected。
除錯器第一次啟動需要較長時間,
後續啟動速度會加快。這個 Flutter 應用程式包含兩個按鈕:
- Launch in browser:此按鈕會在你裝置的預設瀏覽器中開啟此頁面。
- Launch in app:此按鈕會在你的應用程式中開啟此頁面。 此按鈕僅適用於 iOS 或 Android,桌面應用程式會啟動瀏覽器。
在 Visual Studio 中附加至 Flutter 處理程序
#-
若要開啟專案方案檔,請前往 File > Open > Project/Solution…
你也可以按下 Ctrl + Shift + O。
在你的 Flutter 應用程式目錄中選擇
build/windows/my_app.sln檔案。-
前往 Debug > Attach to Process。
你也可以按下 Ctrl + Alt + P。
-
在 Attach to Process 對話框中,選擇
my_app.exe。Visual Studio 開始監控 Flutter 應用程式。
從 Visual Studio 開始除錯
#如果你大多使用 Visual Studio 進行除錯,請從本節開始。
啟動本機 Windows 除錯工具
#-
若要開啟專案方案檔,請前往 File > Open > Project/Solution…
你也可以按下 Ctrl + Shift + O。
在你的 Flutter 應用程式目錄中選擇
build/windows/my_app.sln檔案。-
將
my_app設為啟動專案。 在 Solution Explorer 中,右鍵點擊my_app並選擇 Set as Startup Project。 -
點擊 Local Windows Debugger 開始除錯。
你也可以按下 F5。
當 Flutter 應用程式啟動後,主控台視窗會顯示 一則包含 Dart VM 服務 URI 的訊息,內容類似如下:
flutter: The Dart VM service is listening on http://127.0.0.1:62080/KPHEj2qPD1E=/ 複製 Dart VM 服務 URI。
在 VS Code 中附加至 Dart VM
#-
若要開啟指令選擇區,請前往 View > Command Palette...
你也可以按下 Cmd + Shift + P。
輸入
debug。點擊 Debug: Attach to Flutter on Device 指令。
-
在 Paste an VM Service URI 欄位中,貼上從 Visual Studio 複製的 URI, 然後按下 Enter。
相關資源
#歡迎參考以下關於 Flutter、iOS、Android、macOS 與 Windows 偵錯的資源:
Flutter
#Android
#你可以在 developer.android.com 找到以下偵錯資源。
iOS 與 macOS
#你可以在 developer.apple.com 找到以下偵錯資源。
Windows
#你可以在 Microsoft Learn 找到 Windows 偵錯相關資源。
Unless stated otherwise, the documentation on this site reflects Flutter 3.44.0. Page last updated on 2026-06-14. View source or report an issue.