偵錯你的 add-to-app 模組
如何執行、偵錯與熱重載你的 add-to-app Flutter 模組。
當你已將 Flutter 模組整合進你的專案,並且透過 Flutter 的平台 API 執行 Flutter 引擎與/或 UI 之後, 你就可以像執行一般 Android 或 iOS 應用程式一樣,建置並執行你的 Android 或 iOS 應用程式。
只要你的程式碼中包含 FlutterActivity 或 FlutterViewController,
Flutter 就會負責該處的 UI。
概覽
#
你可能已經習慣在執行 flutter run 或從 IDE 執行等效指令時,
使用你最愛的 Flutter 偵錯工具組。
但在 add-to-app 的情境下,你同樣可以使用所有 Flutter 偵錯功能,
例如熱重載、效能疊加層、DevTools,以及設定中斷點等。
flutter attach 指令提供了這些功能。
你可以使用 SDK 的命令列工具(CLI tools)、VS Code、
IntelliJ IDEA 或 Android Studio 來執行這個指令。
當你執行 FlutterEngine 時,flutter attach 指令會連線。
它會一直保持連線,直到你釋放 FlutterEngine 為止。
你可以在啟動引擎前呼叫 flutter attach。
flutter attach 指令會等待你的引擎所啟動的下一個可用 Dart VM。
從終端機偵錯
#
若要從終端機附加偵錯,請執行 flutter attach。
若要選擇特定目標裝置,請加上 -d <deviceId>。
flutter attach
該指令應該會輸出類似以下的內容:
Syncing files to device iPhone 15 Pro...
 7,738ms (!)

To hot reload the changes while running, press "r".
To hot restart (and rebuild state). press "R".
在 Xcode 與 VS Code 偵錯 iOS 擴充套件
#在終端機中建置 Flutter 應用程式的 iOS 版本
#
若要產生所需的 iOS 平台相依套件,
請執行 flutter build 指令。
flutter build ios --config-only --no-codesign --debug
Warning: Building for device with codesigning disabled. You will have to manually codesign before deploying to device.
Building com.example.myApp for device (ios)...
從 VS Code 開始除錯
#如果你主要使用 VS Code 來除錯程式碼,請從本節開始。
在 VS Code 中啟動 Dart 除錯工具
#-
若要開啟 Flutter 應用程式目錄,請前往 File > Open Folder... 並選擇
my_app目錄。 開啟
lib/main.dart檔案。-
如果你可以為多部裝置建置應用程式, 則必須先選擇裝置。
前往 View > Command Palette...
你也可以按下 Ctrl / Cmd + Shift + P。
輸入
flutter select。點擊 Flutter: Select Device 指令。
選擇你的目標裝置。
-
點擊除錯圖示 (
 )。
這會開啟 Debug 面板並啟動應用程式。
請等待應用程式在裝置上啟動,並等待除錯面板顯示 Connected。
除錯器第一次啟動需要較長時間,
後續啟動速度會加快。
)。
這會開啟 Debug 面板並啟動應用程式。
請等待應用程式在裝置上啟動,並等待除錯面板顯示 Connected。
除錯器第一次啟動需要較長時間,
後續啟動速度會加快。這個 Flutter 應用程式包含兩個按鈕:
- Launch in browser:此按鈕會在你裝置的預設瀏覽器中開啟此頁面。
- Launch in app:此按鈕會在你的應用程式中開啟此頁面。 此按鈕僅適用於 iOS 或 Android,桌面應用程式會啟動瀏覽器。
啟用自動附加
#
你可以設定 VS Code 在開始除錯時自動附加到你的 Flutter 模組專案。
若要啟用此功能,
請在你的 Flutter 模組專案中建立 .vscode/launch.json 檔案。
-
前往 View > Run。
你也可以按 Ctrl / Cmd + Shift + D。
VS Code 會顯示 Run and Debug 側邊欄。
-
在此側邊欄中,點擊 create a launch.json file。
VS Code 會在頂部顯示 Select debugger 選單。
-
選取 Dart & Flutter。
VS Code 會建立並開啟
.vscode/launch.json檔案。展開以查看 launch.json 檔案範例
json{ // Use IntelliSense to learn about possible attributes. // Hover to view descriptions of existing attributes. // For more information, visit: https://go.microsoft.com/fwlink/?linkid=830387 "version": "0.2.0", "configurations": [ { "name": "my_app", "request": "launch", "type": "dart" }, { "name": "my_app (profile mode)", "request": "launch", "type": "dart", "flutterMode": "profile" }, { "name": "my_app (release mode)", "request": "launch", "type": "dart", "flutterMode": "release" } ] } -
若要附加,前往 Run > Start Debugging。
你也可以按 F5。
在 Xcode 中附加至 Flutter 程序
#若要在 Xcode 中附加至 Flutter 應用程式:
-
前往 Debug > Attach to Process。
-
選擇 Runner。它應該位於 Attach to Process 選單頂端的 Likely Targets 標題下方。
從 Xcode 開始除錯
#如果你主要使用 Xcode 來除錯程式碼,請從本節開始。
啟動 Xcode 除錯工具
#從你的 Flutter 應用程式目錄開啟
ios/Runner.xcworkspace。-
使用工具列中的 Scheme 選單選擇正確的裝置。
如果你沒有特別偏好,請選擇 iPhone Pro 14。
-
以一般應用程式的方式在 Xcode 中執行此 Runner。
執行完成後,Xcode 底部的 Debug 區域會顯示 一則包含 Dart VM 服務 URI 的訊息,格式類似如下:
2023-07-12 14:55:39.966191-0500 Runner[58361:53017145] flutter: The Dart VM service is listening on http://127.0.0.1:50642/00wEOvfyff8=/ 複製 Dart VM 服務 URI。
在 VS Code 中附加至 Dart VM
#-
若要開啟指令面板,前往 View > Command Palette...
你也可以按下 Cmd + Shift + P。
輸入
debug。點擊 Debug: Attach to Flutter on Device 指令。
-
在 Paste an VM Service URI 欄位中,貼上你從 Xcode 複製的 URI,然後按下 Enter。
在 Android Studio 偵錯 Android 擴充套件
#-
若要開啟 Flutter 應用程式目錄,請前往 File > Open...,並選擇
my_app目錄。 開啟
lib/main.dart檔案。-
選擇一個 Android 虛擬裝置。 前往工具列,開啟最左側的下拉選單,然後點擊 Open Android Emulator: <device>。
你可以選擇任何已安裝且名稱不含
arm64的模擬器。 在同一選單中,選取該 Android 虛擬裝置。
-
在工具列中,點擊 Run 'main.dart'。
你也可以按下 Ctrl + Shift + R。
應用程式在模擬器中顯示後,繼續進行下一步。
無需 USB 連線進行偵錯
#
若要在 iOS 或 Android 裝置上透過 Wi-Fi 偵錯您的應用程式,
請使用 flutter attach。
在 iOS 裝置上透過 Wi-Fi 偵錯
#針對 iOS 目標,請完成以下步驟:
確認您的裝置已如 iOS 設定指南 所述,透過 Wi-Fi 連接至 Xcode。
-
在您的 macOS 開發機上, 開啟 Xcode > Product > Scheme > Edit Scheme...。
您也可以按下 Cmd + <。
點擊 Run。
點擊 Arguments。
-
在 Arguments Passed On Launch 中,點擊 +。
如果您的開發機使用 IPv4,請加入
--vm-service-host=0.0.0.0。如果您的開發機使用 IPv6,請加入
--vm-service-host=::0。
<DashImage figure img-class="site-mobile-screenshot border" image="development/add-to-app/debugging/wireless-port.png" caption="已加入 IPv4 網路的 Arguments Passed On Launch", width="100%" />
如何判斷您是否處於 IPv6 網路
#開啟 設定 > Wi-Fi。
點擊您已連線的網路。
點擊 詳細資訊...
點擊 TCP/IP。
-
檢查是否有 IPv6 位址 區段。
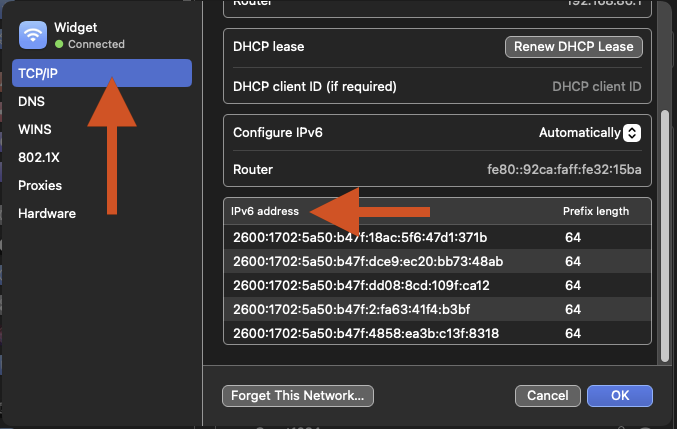
macOS 系統設定中的 WiFi 對話框
在 Android 裝置上透過 Wi-Fi 偵錯
#請確認您的裝置已如 Android 設定指南 所述,透過 Wi-Fi 連接至 Android Studio。
Unless stated otherwise, the documentation on this site reflects Flutter 3.44.0. Page last updated on 2026-06-14. View source or report an issue.